

Website speed and performance
A website that loads in the blink of an eye, and a portal that stands up to tens of thousands of people a day. We measure speed in the browser and on the server, not by guesswork.
What we can do
We build speed from parts we know in detail. Each one is described by how it works, together with the measured value for this website.
-
First render in the blink of an eye
The styles are 25 kB, the main font weight is preloaded and the largest image on the page gets high priority. Whatever is below the fold loads only on the way. We measure LCP, the moment when the largest element of the page appears.
Page this website's home page on a computer measured LCP 220 ms
-
Fast even on a slow phone
On a weak phone, what matters is how much a page needs before it appears. Scripts load only when needed, and the browser renders long sections only when the reader reaches them.
Page service page, 4G, 4× slower processor measured LCP 510 ms
-
Nothing jumps
Images have their dimensions before they arrive, and the fallback font has the same metrics as the web font, so the text does not reflow when the font is swapped. We measure CLS, the sum of content shifts.
Page service page, first visit measured CLS 0
-
Server response in milliseconds
The application stays in memory between requests, the cache is prepared at build time, and static files have unlimited validity in the browser. We measure TTFB, the time to the first byte of the response. The Payminator company website responds within 25 ms in 95% of cases, the Payminator Daně application within 55 ms.
Measurement server response of this website measured TTFB 20 ms
-
Images that weigh nothing
We convert every image to AVIF and WebP in widths for each screen, and the browser takes the smallest one that is enough. Below the fold it loads lazily.
Image screenshot of the portal on a phone measured 291 kB JPG 25 kB AVIF
-
Data without waiting
We find slow queries in performance profiles, add indexes, and precompute or hold in the cache whatever is calculated often.
Calculation query vector for search by meaning measured 13 ms, then a day in the cache
-
We monitor and optimise continuously
We monitor the speed and performance of our applications continuously, during development and in operation, and optimise according to what the data shows. We see every click along its whole path, from the browser through the server and cache to individual database queries. The development version of the personnel portal has a performance score of 98 out of 100.
Measurement the slowest server component of the portal measured 2.45 ms
-
In multiple languages
Each language version has its own addresses and the same structure, so it loads as fast as the Czech one.
Page /en/website-creation, 4G, 4× slower CPU measured LCP 520 ms, Czech version 510 ms
How we build it
Speed is not guessed, it is measured. On a computer and on a slow phone, in the browser and on the server, and again after every major change.
-
Measurement, not guesswork We measure the website on a computer and on a slow phone, and the server in operation. The performance profiles show where time is lost.
-
Fixing the biggest loss We start with whatever holds things up the most, for example an image without dimensions, a blocking script or a slow database query.
-
Monitoring in operation After every major change we measure again and watch operation continuously, so that speed is not lost as new features arrive.
Access
- Measurement in the browser
- Chrome DevTools, Lighthouse, Core Web Vitals (LCP, CLS, INP)
- Measurement in operation
- Sentry, traces from the browser all the way to the database, and Web Vitals of real users
- Worker mode
- FrankenPHP, the application stays in memory between requests
- Cache
- Redis, application cache, pages generated in advance (Next.js SSG) and static files with unlimited validity in the browser
- Database optimisation
- PostgreSQL and MariaDB, indexes based on real queries, analysis of slow queries from performance profiles
- Moving to the next page
- prefetch, the next page starts loading as soon as the link is pressed
- Images
- AVIF and WebP in widths for every screen
- Delivery
- Traefik, HTTP/3, zstd compression
This is a selection. We choose technologies according to the needs of the project.
Where performance holds up every day
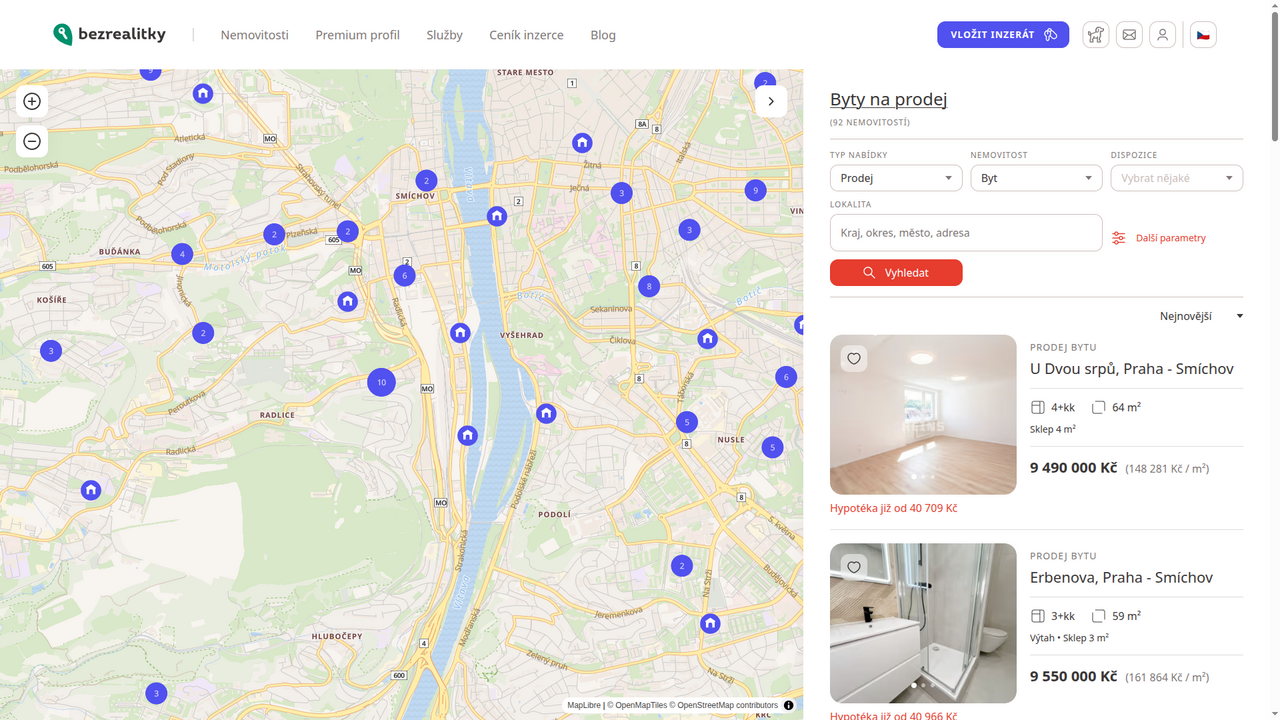
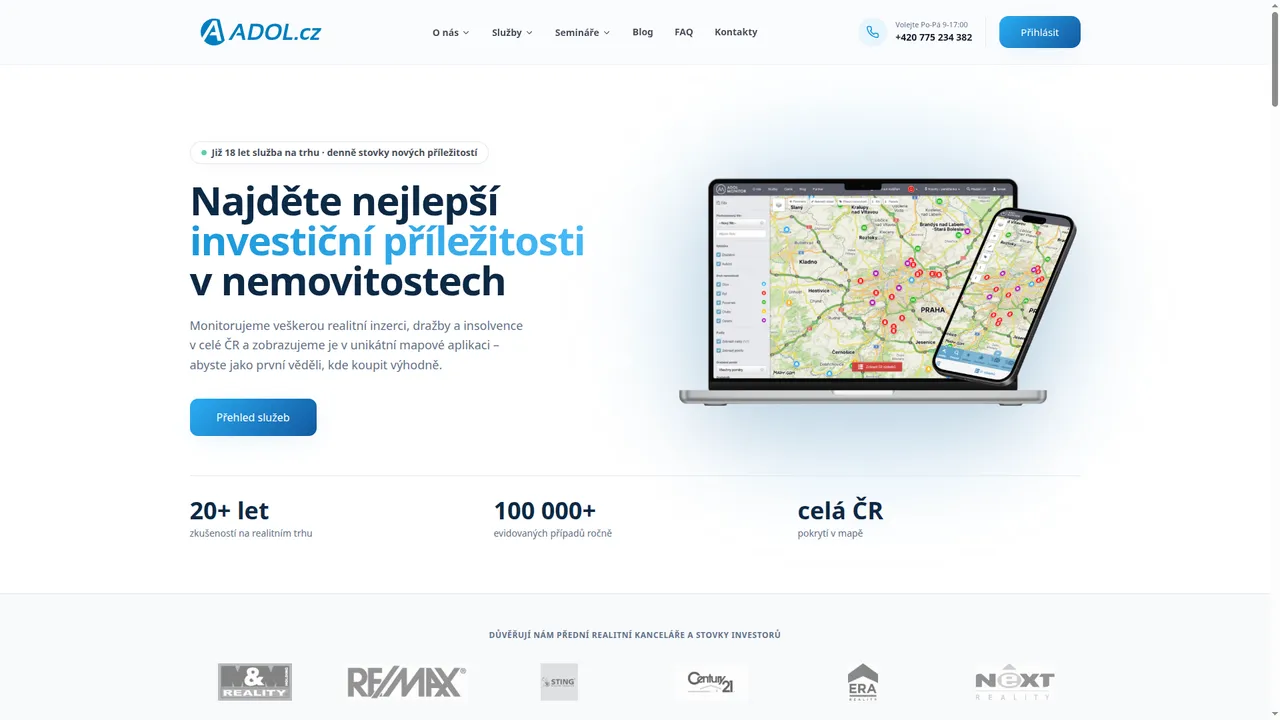
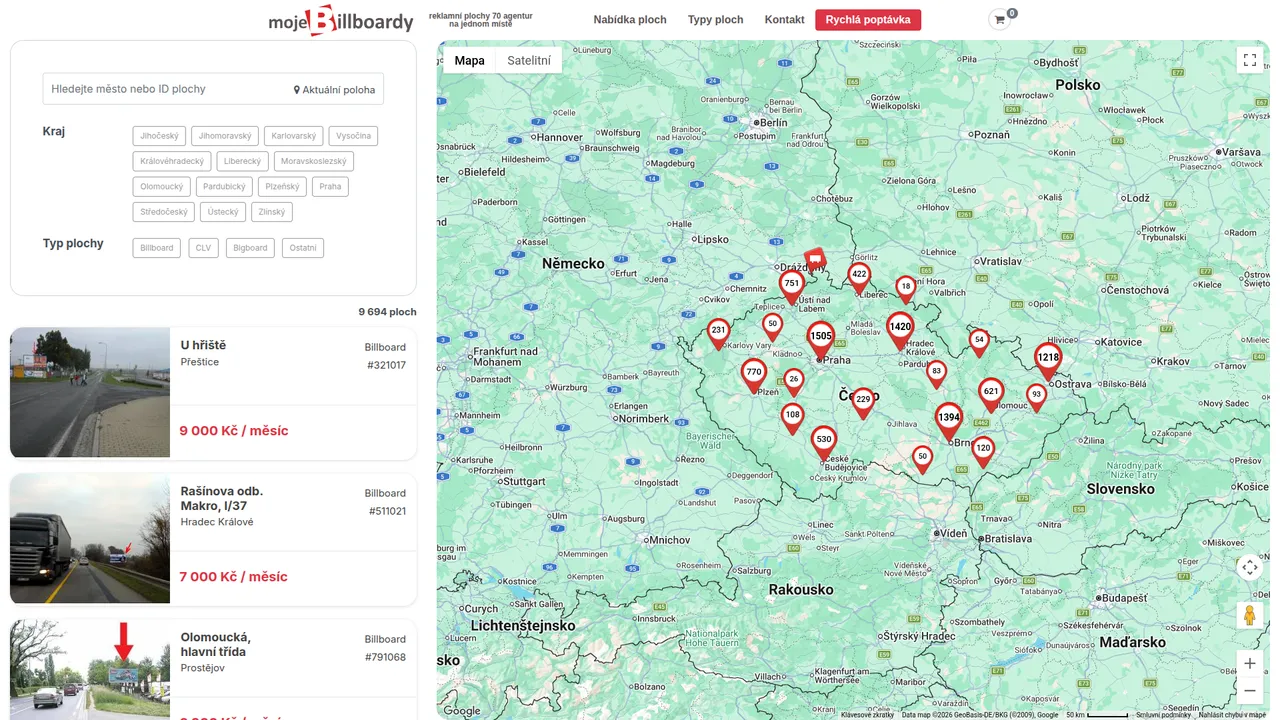
The speed of this website is measured above. Performance under load is demonstrated by portals we have been developing and running for years.
We can do a lot
A fast website rests on a fast server and good search. We build every project from these capabilities.
- Servers and operations From a shared server to dedicated servers and the cloud. Designed, run and monitored 24/7.
- Advanced data search Typos and meaning, hundreds of thousands of records, responses in tens of milliseconds.
- Maps and geodata Addresses in the right place, nearby search and route planning.
- AI and local models You decide where your data may go. Answers come with sources, and we work with text, images and audio.
- System integration and data collection Systems from different vendors working as one. Adol Monitor reads dozens of sources every day.
- Findability and analytics Visible in search engines and to AI assistants. Measuring your goals, even without cookies.
- Cookies, GDPR and accessibility A consent bar by the rules and, where possible, a website without one. Accessibility from the start.